Data Analytics Courses In Pune
Dreaming of a well-paying career? The answer is here!
India has an urgent demand for Data Analysts. Master the art of data-driven decision-making with our comprehensive Data Analytics course! Learn data visualization, statistical analysis, SQL, Python, and machine learning techniques. Gain hands-on experience with real-world projects and industry tools. Start your journey toward a career in data analytics today.
Fuel Your Ambition with Expert Guidance
Course Includes
Projects
Assignments
Lifetime Access
Certificate
(Course Completion)
Interview Preparation
(DSA and Soft skills training)
100% Placement Assistance
(Actual Interview Calls)
Our Alumni Are Employed At
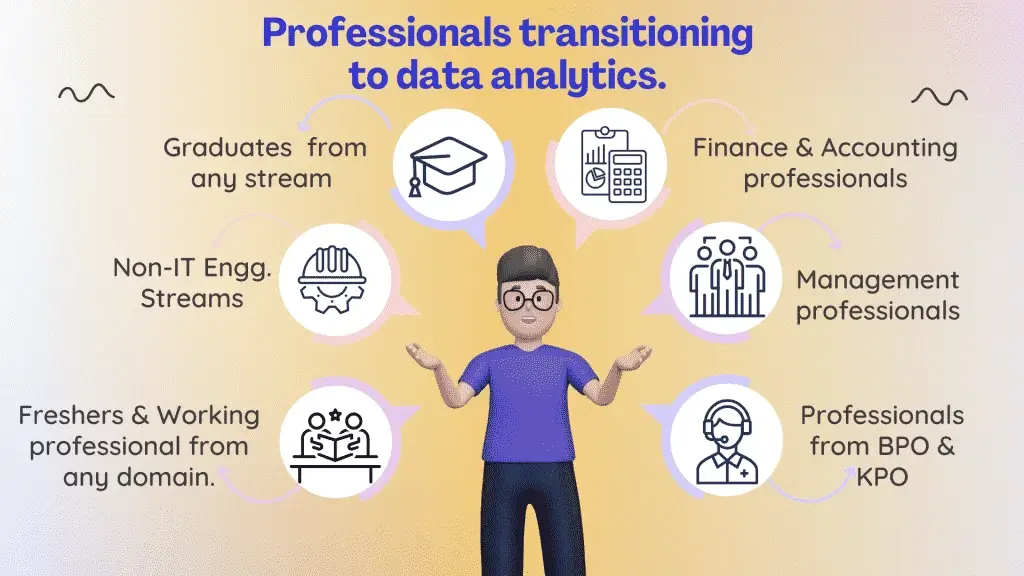
Who Is Suited for the Data Analyst Course?
Data Analytics Certification Course Outline
Duration : 6 months
Sessions :
- Weekdays – 4 per week
- Weekends – 2 per week
Prerequisites :
- There is no such Prerequisites for this course.
- Basic computer knowledge will be advantage.
Database
Python
Advanced Excel
Tableau
PowerBI
Skills Covered:
Database Concepts
Data Analysis Concepts
Functions Charts & Slicers
Data Visualization
Skill development track
Features of Our Courses
Why Choose Us?
Best Industry Experts
Real Time Trainers(10+ Years exp): MNC working professional
Learn online and in-class lab
Hands-on exposure through "online and in-class lab" sessions, assignments and projects
Weekday and Weekend Batches
Convenient Timing for college Students, Freshers and Professionals
Small Batch Size
Small batch size for high focus, personal attention to every student and hassle free interactions with trainer. 7-8 candidates in a batch
Life time Access
Life time video content access: Classes Recordings
Back up Classes
In case you miss few classes
Repeat Classes
In case of doubts (within one year of joining)
Live Project & Deployment
Build real world applications under the guidance of industry experts and Learn how to upload application on server after Project Completion
Career Assistance
Soft skill Training, DSA Training, Resume building, Mock interviews, LinkedIn Profile Creation and Maintaining, 1:1 mentorship and Career fair
100% Placement Assistance
We will give Unlimited Interview Calls
Certificate of Training
We will provide course completion certificate
FAQ (Frequently Asked Quotions)
Our data analyst course in Pune will be 6 months in duration covering all aspects of data analytics.
Anyone interested in data analytics, whether a student, working professional, or career switcher, can join our program. No prior experience is required.
Our data analytics training in Pune covers Python, SQL, Excel, data visualization, and machine learning basics, along with hands-on projects.
Yes! We offer both online and classroom-based data analytics courses, allowing students to choose the mode that best fits their schedule.
Yes, upon successfully completing the program, you’ll receive an industry-recognized certification that can boost your job prospects.
Absolutely! We provide resume-building, interview preparation, and job placement support to help students transition into data analytics roles.
Our data analytics classes in Pune include training in Python, R, Adv. Excel, SQL, Tableau, and Power BI to prepare you for real-world data analysis.
Graduates can pursue roles such as Data Analyst, Business Intelligence Analyst, Data Engineer, or Market Research Analyst in top companies.
You can apply through our website or contact our admissions team for guidance on the enrollment process.
With expert trainers, hands-on projects, and a job-oriented curriculum, our data analyst course helps you build practical skills for a successful career in data analytics.