Course Overview
Who can use Power BI ?
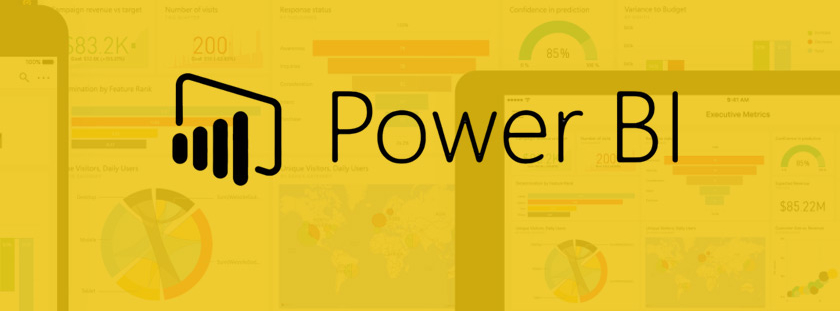
Power BI Features
- Range of Attractive Visualizations. Visualizations i.e. the visual representation of data plays a central role in Power BI.
- Get Data (Data Source).
- Datasets Filtration.
- Customizable Dashboards.
- Flexible Tiles.
- Navigation Pane.
- Informative Reports.
- Natural Language Q & A Question Box.
Duration : 5 - 6 weekends
Sessions : Weekends - 2 per week
Prerequisites :
- Prior knowledge in Excel will be helpful to learn it faster.
Course Curriculum
- Introduction to Data warehouse
- Data warehouse Tools
- What is Power BI?
- Power BI – Flow of Activity
- Building Blocks of Power BI
- Power BI – Primary Tools : Power Pivot, Power Query, Power View, Power Map, Power Q&A, Power BI Desktop
- Power BI Desktop – Install
- Data Sources and Connections
- Connect to Data in Power BI Desktop
- How to use Query Editor in Power BI
- Advanced Data Changes and Transformation
- Views in Power BI Desktop
- Modeling Data - Manage Data Relationship, Create Calculated Columns, Optimize Data Models
- What is DAX?
- Data Types in DAX
- Calculation Types
- DAX Functions : Date and Time, Time Intelligence, Information, Logical, Mathematical, Statistical, Text, Aggregate Measures in DAX
- Table Relationships and DAX
- Why Data Visualization
- Practices for Data Visualization
- How to use Visual in Power BI
- Reports in Power BI
- Charts in Power BI (Scatter, Waterfall, Funnel)
- Slicers
- Map Visualizations
- Gauges and Single Number Cards
- What Are Custom Visuals?
- Office Store
- Downloading Custom Visuals
- Importing Custom Visuals in Power BI Report
- KPI Visuals
- Data Binding in Power BI
- Data Gateways
- Content packs
- Power BI Report Server
- Power BI Embedded Conceptual Model
- Workspace Collection
- Adding Power BI content to a Workspace
- Power BI Q&A
- Dashboard
- Dashboard vs Reports
- Creating a Dashboard
- Dashboard Tiles
- Pinning Tiles
- Quick Insights with Power BI
- Power BI Publisher for Excel
Note :
- Hands-on exposure through "online and in-class lab" sessions and projects
- Real Time Trainers(10+ Years exp): MNC working professional
- Complete hands-on exposure through projects
- Mentorship from experts to gain industry insights
- Limited size of 4 per batch
- Life time video content access: Classes recordings
- Back up classes: in case you miss few classes
- Repeat classes: in case of doubts
- 100% Placement Assistance
- Career Assistance : Resume building, Mock interviews, 1 : 1 mentorship and Career fair
Course Includes

Power BI
Projects

Power BI Assignments

Power BI Certificate
(course Completion)

100% Job Assistance

Free Software installation
Lifetime Access
Course Enrollment Form
Reviews
Sushant Mishra
I completed my tableau and powerbi from ITview. I gotta say it was a wonderful learning for me. Abhijit kaware sir was awesome. He made it so easy for us. I surely recommend this to everyone out there who wants to make a career in IT. The classroom training and facilities are well developed for a great learning environment.
Sumit Ahire
I have Completed Tableau & BI Classes. ITview has certified trainer. Detailed in Peer To Peer attention. very good experience overall. The way course was conducted was very easy to understand.
Priya Wasnik
Good Teaching provided by Abhijit Sir on Tableau and Power BI.
Akshay Kavirajwar
Had a good experience..nice and supportive teaching staff..